This article explains how to centralize logs from a Kubernetes cluster and manage permissions and partitionning of project logs thanks to Graylog (instead of ELK). The fact is that Graylog allows to build a multi-tenant platform to manage logs. Let’s take a look at this.
Reminders about logging in Kubernetes
As it is stated in Kubernetes documentation, there are 3 options to centralize logs in Kubernetes environements.
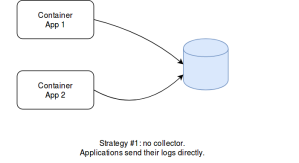
The first one is about letting applications directly output their traces in other systems (e.g. databases). This approach always works, even outside Docker. However, it requires more work than other solutions. Not all the applications have the right log appenders. It can also become complex with heteregenous Software (consider something less trivial than N-tier applications). Eventually, log appenders must be implemented carefully: they should indeed handle network failures without impacting or blocking the application that use them, while using as less resources as possible. So, althouth it is a possible option, it is not the first choice in general.
The second solution is specific to Kubernetes: it consists in having a side-car container that embeds a logging agent. This agent consumes the logs of the application it completes and sends them to a store (e.g. a database or a queue). This approach is better because any application can output logs to a file (that can be consumed by the agent) and also because the application and the agent have their own resources (they run in the same POD, but in different containers). Side-car containers also gives the possibility to any project to collect logs without depending on the K8s infrastructure and its configuration. However, if all the projets of an organization use this approach, then half of the running containers will be collecting agents. Even though log agents can use few resources (depending on the retained solution), this is a waste of resources. Besides, it represents additional work for the project (more YAML manifests, more Docker images, more stuff to upgrade, a potential log store to administrate…). A global log collector would be better.
That’s the third option: centralized logging. Rather than having the projects dealing with the collect of logs, the infrastructure could set it up directly. The idea is that each K8s minion would have a single log agent and would collect the logs of all the containers that run on the node. This is possible because all the logs of the containers (no matter if they were started by Kubernetes or by using the Docker command) are put into the same file. What kubectl log does, is reading the Docker logs, filtering the entries by POD / container, and displaying them. This approach is the best one in terms of performances. What is difficult is managing permissions: how to guarantee a given team will only access its own logs. Not all the organizations need it. Small ones, in particular, have few projects and can restrict access to the logging platform, rather than doing it IN the platform. Anyway, beyond performances, centralized logging makes this feature available to all the projects directly. They do not have to deal with logs exploitation and can focus on the applicative part.
Centralized Logging in K8s
Centralized logging in K8s consists in having a daemon set for a logging agent, that dispatches Docker logs in one or several stores. The most famous solution is ELK (Elastic Search, Logstash and Kibana). Logstash is considered to be greedy in resources, and many alternative exist (FileBeat, Fluentd, Fluent Bit…). The daemon agent collects the logs and sends them to Elastic Search. Dashboards are managed in Kibana.
Things become less convenient when it comes to partition data and dashboards. Elastic Search has the notion of index, and indexes can be associated with permissions. So, there is no trouble here. But Kibana, in its current version, does not support anything equivalent. All the dashboards can be accessed by anyone. Even though you manage to define permissions in Elastic Search, a user would see all the dashboards in Kibana, even though many could be empty (due to invalid permissions on the ES indexes). Some suggest to use NGinx as a front-end for Kibana to manage authentication and permissions. It seems to be what Red Hat did in Openshift (as it offers user permissions with ELK). What I present here is an alternative to ELK, that both scales and manage user permissions, and fully open source. This relies on Graylog.
Here is what Graylog web sites says: « Graylog is a leading centralized log management solution built to open standards for capturing, storing, and enabling real-time analysis of terabytes of machine data. We deliver a better user experience by making analysis ridiculously fast, efficient, cost-effective, and flexible. »
I heard about this solution while working on another topic with a client who attended a conference few weeks ago. And indeed, Graylog is the solution used by OVH’s commercial solution of « Log as a Service » (in its data platform products). This article explains how to configure it. It is assumed you already have a Kubernetes installation (otherwise, you can use Minikube). To make things convenient, I document how to run things locally.
Architecture
Graylog is a Java server that uses Elastic Search to store log entries.
It also relies on MongoDB, to store metadata (Graylog users, permissions, dashboards, etc).
What is important is that only Graylog interacts with the logging agents. There is no Kibana to install. Graylog manages the storage in Elastic Search, the dashboards and user permissions. Elastic Search should not be accessed directly. Graylog provides a web console and a REST API. So, everything feasible in the console can be done with a REST client.
Deploying Graylog, MongoDB and Elastic Search
Obviously, a production-grade deployment would require a highly-available cluster, for both ES, MongoDB and Graylog. But for this article, a local installation is enough. A docker-compose file was written to start everything. As ES requires specific configuration of the host, here is the sequence to start it:
sudo sysctl -w vm.max_map_count=262144
docker-compose -f compose-graylog.yml up
You can then log into Graylog’s web console at http://localhost:9000 with admin/admin as credentials. Those who want to create a highly available installation can take a look on Graylog’s web site.
Deploying the Collecting Agent in K8s
As discussed before, there are many options to collect logs.
I chose Fluent Bit, which was developed by the same team than Fluentd, but it is more performant and has a very low footprint. There are also less plug-ins than Fluentd, but those available are enough.
What we need to is get Docker logs, find for each entry to which POD the container is associated, enrich the log entry with K8s metadata and forward it to our store. Indeed, Docker logs are not aware of Kubernetes metadata. We therefore use a Fluent Bit plug-in to get K8s meta-data. I saved on Github all the configuration to create the logging agent. It gets logs entries, adds Kubernetes metadata and then filters or transforms entries before sending them to our store.
The message format we use is GELF (which a normalized JSON message supported by many log platforms). Notice there is a GELF plug-in for Fluent Bit. However, I encountered issues with it. As it is not documented (but available in the code), I guess it is not considered as mature yet. Instead, I used the HTTP output plug-in and built a GELF message by hand. Here is what it looks like before it is sent to Graylog.
{
"short_message":"2019/01/13 17:27:34 Metric client health check failed...",
"_stream":"stdout",
"_timestamp":"2019-01-13T17:27:34.567260271Z",
"_k8s_pod_name":"kubernetes-dashboard-6f4cfc5d87-xrz5k",
"_k8s_namespace_name":"test1",
"_k8s_pod_id":"af8d3a86-fe23-11e8-b7f0-080027482556",
"_k8s_labels":{},
"host":"minikube",
"_k8s_container_name":"kubernetes-dashboard",
"_docker_id":"6964c18a267280f0bbd452b531f7b17fcb214f1de14e88cd9befdc6cb192784f",
"version":"1.1"
}
Eventually, we need a service account to access the K8s API.
Indeed, to resolve to which POD a container is associated, the fluent-bit-k8s-metadata plug-in needs to query the K8s API. So, it requires an access for this.
You can find the files in this Git repository. The service account and daemon set are quite usual. What really matters is the configmap file. It contains all the configuration for Fluent Bit: we read Docker logs (inputs), add K8s metadata, build a GELF message (filters) and sends it to Graylog (output). Take a look at the Fluent Bit documentation for additionnal information.
Configuring Graylog
There many notions and features in Graylog.
Only few of them are necessary to manage user permissions from a K8s cluster. First, we consider every project lives in its own K8s namespace. If there are several versions of the project in the same cluster (e.g. dev, pre-prod, prod) or if they live in different clusters does not matter. What is important is to identify a routing property in the GELF message. So, when Fluent Bit sends a GELF message, we know we have a property (or a set of properties) that indicate(s) to which project (and which environment) it is associated with. In the configmap stored on Github, we consider it is the _k8s_namespace property.
Now, we can focus on Graylog concepts.
We need…
An input
An input is a listener to receive GELF messages.
You can create one by using the System > Inputs menu. In this example, we create a global one for GELF HTTP (port 12201). There are many options in the creation dialog, including the use of SSL certificates to secure the connection.
Indices
Graylog indices are abstractions of Elastic indexes. They designate where log entries will be stored. You can associate sharding properties (logical partition of the data), retention delay, replica number (how many instances for every shard) and other stuff to a given index. Every projet should have its own index: this allows to separate logs from different projects. Use the System > Indices to manage them.
A project in production will have its own index, with a bigger retention delay and several replicas, while a developement one will have shorter retention and a single replica (it is not a big issue if these logs are lost).
Streams
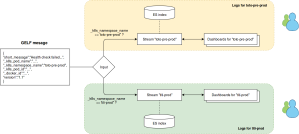
A stream is a routing rule. They can be defined in the Streams menu. When a (GELF) message is received by the input, it tries to match it against a stream. If a match is found, the message is redirected into a given index.
When you create a stream for a project, make sure to check the Remove matches from ‘All messages’ stream option. This way, the log entry will only be present in a single stream. Otherwise, it will be present in both the specific stream and the default (global) one.
The stream needs a single rule, with an exact match on the K8s namespace (in our example).
Again, this information is contained in the GELF message. Notice that the field is _k8s_namespace in the GELF message, but Graylog only displays k8s_namespace in the proposals. The initial underscore is in fact present, even if not displayed.
Do not forget to start the stream once it is complete.
Dashboards
Graylog’s web console allows to build and display dashboards.
Make sure to restrict a dashboard to a given stream (and thus index). Like for the stream, there should be a dashboard per namespace. Using the K8s namespace as a prefix is a good option.
Graylog provides several widgets…
Take a look at the documentation for further details.
Roles
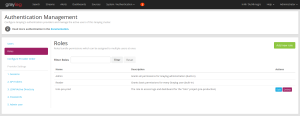
Graylog allows to define roles.
A role is a simple name, coupled to permissions (roles are a group of permissions). You can thus allow a given role to access (read) or modify (write) streams and dashboards. For a project, we need read permissions on the stream, and write permissions on the dashboard. This way, users with this role will be able to view dashboards with their data, and potentially modifying them if they want.
Roles and users can be managed in the System > Authentication menu.
Users
Apart the global administrators, all the users should be attached to roles.
These roles will define which projects they can access. You can consider them as groups. When a user logs in, Graylog’s web console displays the right things, based on their permissions.
There are two predefined roles: admin and viewer.
Any user must have one of these two roles. He (or she) may have other ones as well. When a user logs in, and that he is not an administrator, then he only has access to what his roles covers.
Clicking the stream allows to search for log entries.
Notice that there are many authentication mechanisms available in Graylog, including LDAP.
Summary
Graylog uses MongoDB to store metadata (stream, dashboards, roles, etc) and Elastic Search to store log entries. We define an input in Graylog to receive GELF messages on a HTTP(S) end-point. These messages are sent by Fluent Bit in the cluster.
When such a message is received, the k8s_namespace_name property is verified against all the streams.
When one matches this namespace, the message is redirected in a specific Graylog index (which is an abstraction of ES indexes). Only the corresponding streams and dashboards will be able to show this entry.
Eventually, only the users with the right role will be able to read data from a given stream, and access and manage dashboards associated with it. Logs are not mixed amongst projects. Isolation is guaranteed and permissions are managed trough Graylog.
In short : 1 project in an environment = 1 K8s namespace = 1 Graylog index = 1 Graylog stream = 1 Graylog role = 1 Graylog dashboard. This makes things pretty simple. You can obviously make more complex, if you want…
Testing Graylog
You can send sample requests to Graylog’s API.
# Found on Graylog's web site
curl -X POST -H 'Content-Type: application/json' -d '{ "version": "1.1", "host": "example.org", "short_message": "A short message", "level": 5, "_some_info": "foo" }' 'http://192.168.1.18:12201/gelf'
This one is a little more complex.
# Home made
curl -X POST -H 'Content-Type: application/json' -d '{"short_message":"2019/01/13 17:27:34 Metric client health check failed: the server could not find the requested resource (get services heapster). Retrying in 30 seconds.","_stream":"stdout","_timestamp":"2019-01-13T17:27:34.567260271Z","_k8s_pod_name":"kubernetes-dashboard-6f4cfc5d87-xrz5k","_k8s_namespace_name":"test1","_k8s_pod_id":"af8d3a86-fe23-11e8-b7f0-080027482556","_k8s_labels":{},"host":"minikube","_k8s_container_name":"kubernetes-dashboard","_docker_id":"6964c18a267280f0bbd452b531f7b17fcb214f1de14e88cd9befdc6cb192784f","version":"1.1"}' http://localhost:12201/gelf
Feel free to invent other ones…
Automating stuff
Every features of Graylog’s web console is available in the REST API.
It means everything could be automated. Every time a namespace is created in K8s, all the Graylog stuff could be created directly. Project users could directly access their logs and edit their dashboards.
Check Graylog’s web site for more details about he API. When you run Graylog, you can also access the Swagger definition of the API at http://localhost:9000/api/api-browser/
Going further
The resources in this article use Graylog 2.5.
The next major version (3.x) brings new features and improvements, in particular for dashboards. There should be a new feature that allows to create dashboards associated with several streams at the same time (which is not possible in version 2.5, a dashboard being associated with a single stream – and so a single index). That would allow to have transverse teams, with dashboards that span across several projects.
See https://www.graylog.org/products/latestversion for more details.
Hints for Tests
If you do local tests with the provided compose, you can purge the logs by stopping the compose stack and deleting the ES container (docker rm graylogdec2018_elasticsearch_1). Then restart the stack.
If you remove the MongoDB container, make sure to reindex the ES indexes.
Or delete the Elastic container too.


